History and Chart
Entity details include History and Chart tabs for analysis and audit.
History Tab
Section titled “History Tab”- Filter by date range
- Filter by changed attributes
- Inspect before/after value changes
- Track change timing and relative recency
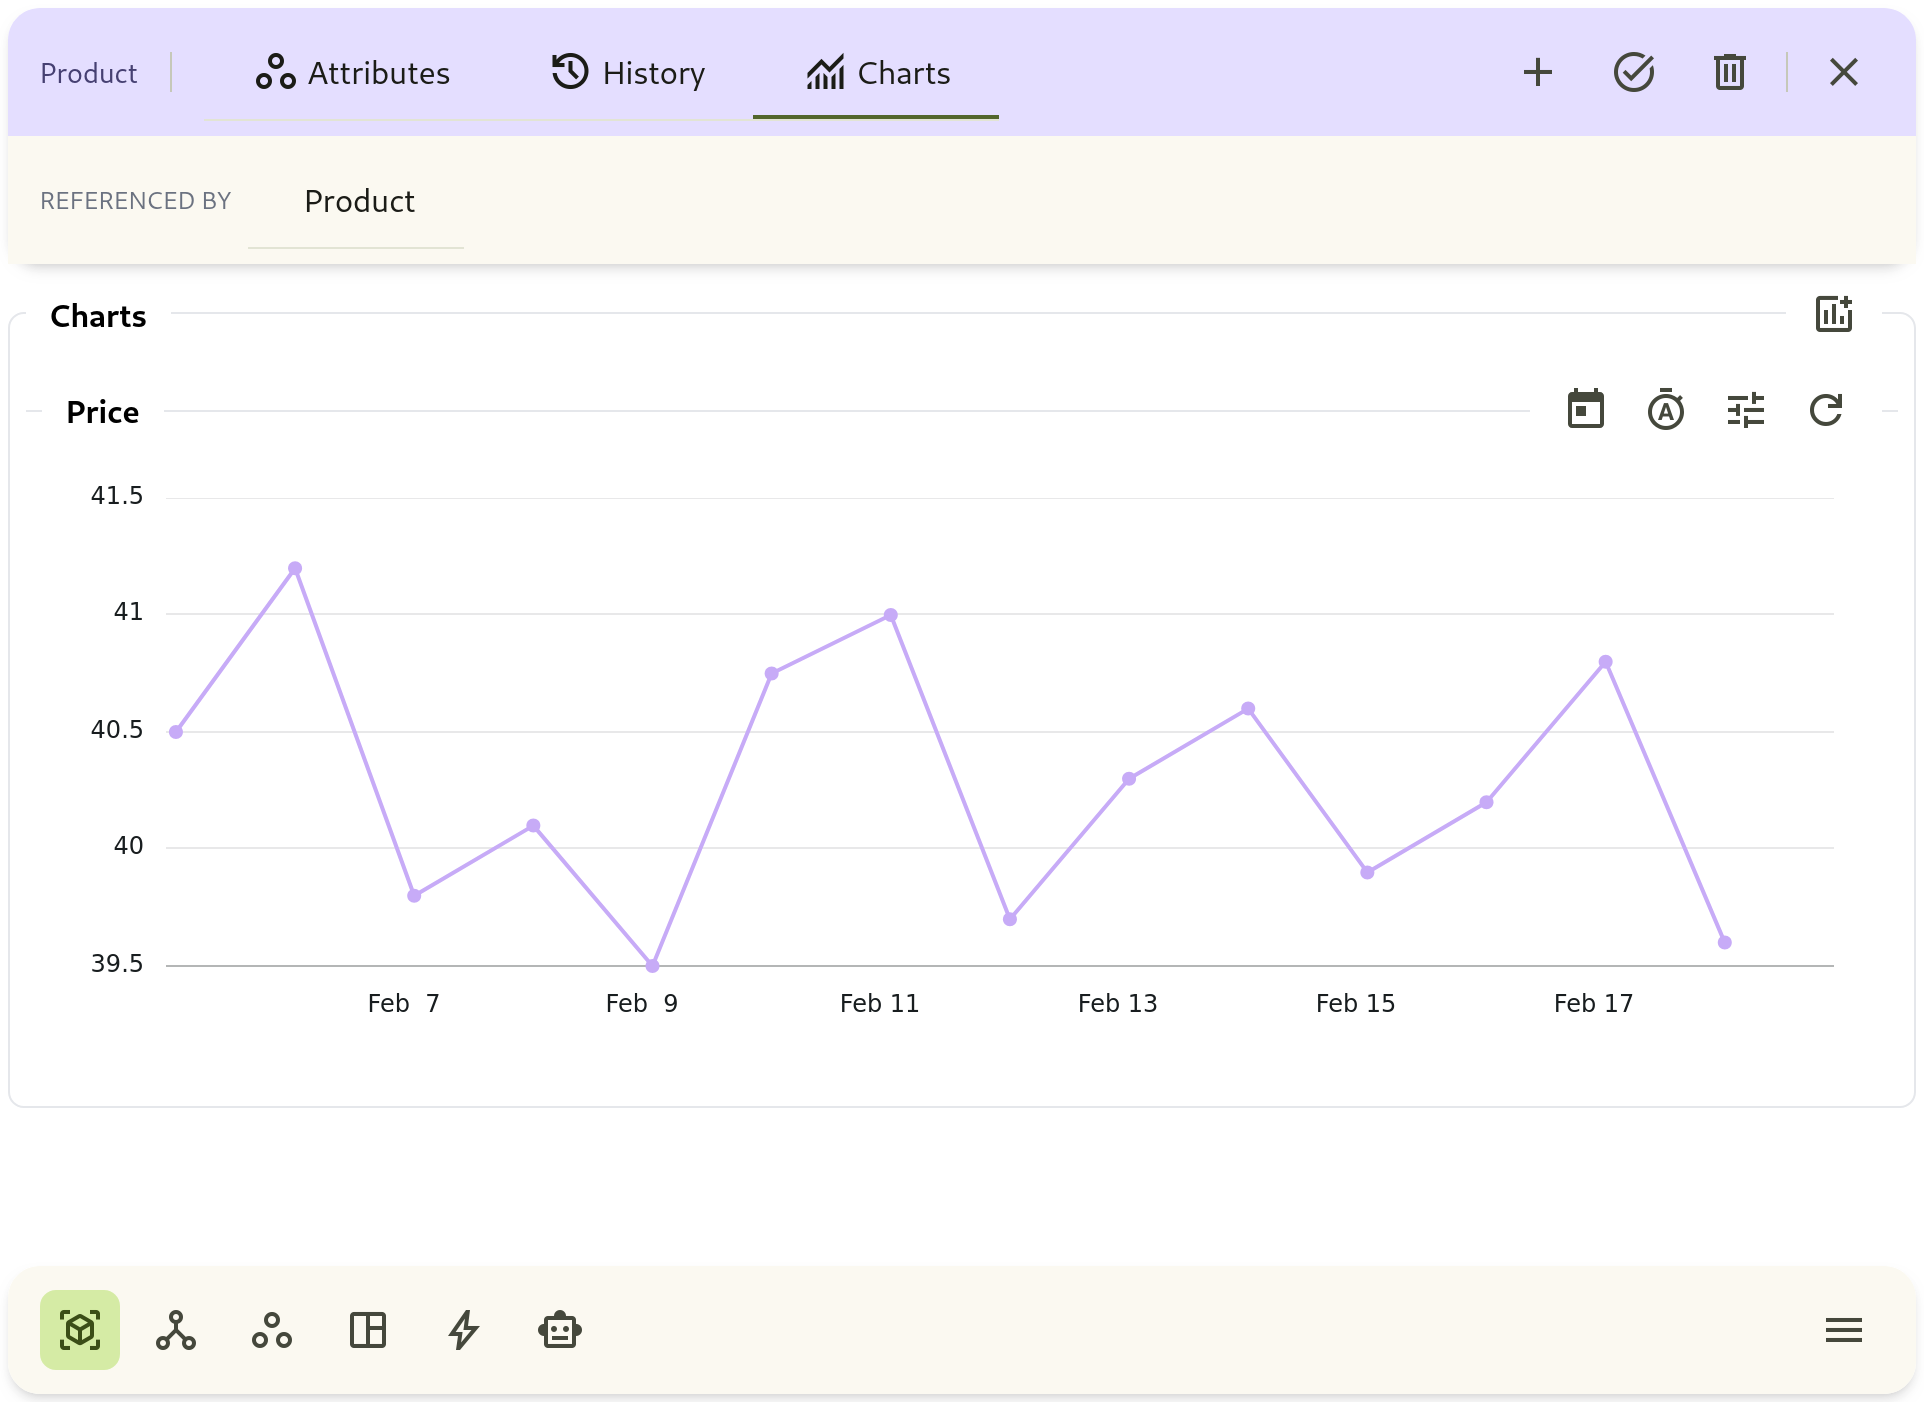
Chart Tab
Section titled “Chart Tab”- Select one or more metric attributes
- Choose aggregate function: avg, first, last, max, min, sum
- Choose bucket width: from seconds to month
- Adjust time range and compare patterns
Backfilled Data
Section titled “Backfilled Data”If attribute values were pushed via the REST API with a custom updated_at timestamp, they appear at the correct position in the timeline — both in the History tab and in metric charts. This ensures that data buffered during a connectivity outage is visualised accurately once replayed, with no gaps or shifted readings.
See Pushing Data via the REST API for details.